
Many linguists are also fan of maps, which can be a very neat tool to illustrate areal phenomena. Many maps are also easily accessible to non-linguists. For instance, the past years popular ‘etymology maps’ of Europe have been circulating the web, illustrating the distribution of a different roots for a certain concepts, e.g. camels, cucumbers, garlic etc.
Of course, maps, like any visual representation, can be deceptive. Common criticisms of these maps include e.g. de-emphasizing the presence of a minority language, in some cases over-emphasizing it. Sometimes they use state borders instead of linguistic borders, and languages with no clear geographical borders sometimes are not represented at all.
Nevertheless, I have been intrigued by linguistic maps for as long as I have been interested in linguistics, and I was part of etymology map trend from the very beginning. Already then, I noticed that mapmaking can be quite a tedious task. If you already had e.g. a map of Europe with the defined linguistic areas, would it not be possible to let a script color the map for you, just by feeding it the data? That way, you could spit out etymology maps of hundred of food etymologies in no time.
I started looking at ways in which the coloring part of the map could be automated. This post will serve as some inspiration for automated mapmaking for map-interested linguists. I will use a few lines of programming in Python, and some mapmaking in Inkscape. I am a linguist, not a programmer, so I apologize in advance for my crude code and explanations.
Creating a basemap
I started by creating a map with linguistic areas, which we will feed with spreadsheet data later. I made my basemap in SVG format, a vector format where the image is made up by geometry rather than pixels, because then the graphic can be edited through programming and has very high quality.
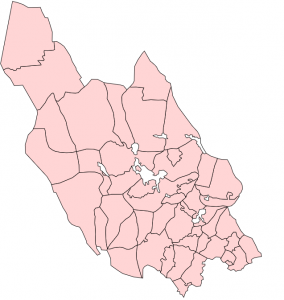
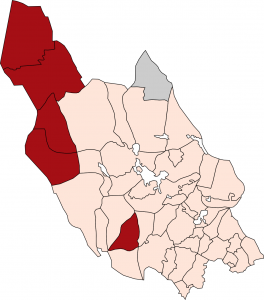
My basemap is of the Swedish region of Dalarna. I made it in Inkscape (like Photoshop, but for SVG) by tracing an older map of the parishes (Sw. socknar) of Dalarna – the parishes will serve as linguistic areas. In my SVG file, each parish is a path object, a geometrical shape, and in Inkscape you can give a unique ID to each object, so each parish has received a parish code in the SVG map below.
Creating the spreadsheet with data
Next, I made spreadsheet of the data that I want to illustrate. I have chosen two features:
(1) fortition of older *hw > gv, kv, e.g. *hwass ‘sharp’ > Lima gvass (but Älvdalen wass)
(2) loss of initial *h, e.g. *hesst ’horse’ > Orsa esst (but Nås hässt).
Therefore, my spreadsheet will have this structure:
| parish | parish_code | hw-fortition | loss_of_h |
| Älvdalen | 2392 | no | yes |
| Lima | 2362 | yes | no |
| Orsa | 2370 | no | yes |
| Idre | 2357 | yes | no |
| Ål | 2391 | no | no |
| Nås | 2368 | yes | no |
| etc. |
Of course, this data is small enough be colored ‘by hand’, but we could easily imagine having 100 features, generating 100 maps.
Coloring a parish through XML
The graphics in an SVG file is defined using XML (which is similar to HTML). This means that just like we can change the color of a webpage in HTML, we can change the color of our linguistic area by changing the style and setting a new ‘fill’ color.
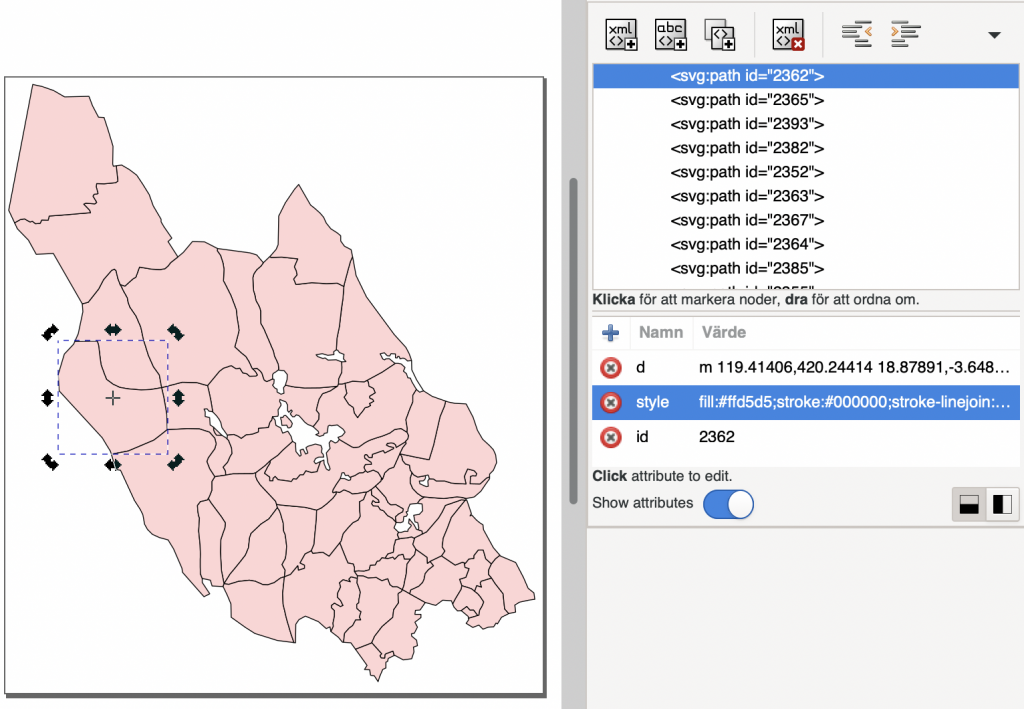
In the screenshot above, I have highlighted the parish of Lima (code 2362), and as you can see it has three attributes.
(1) d, the definition of the path, i.e. the lines and curves of the shape.
(2) style, the look of the path, for instance the width of its borders and crucially, the color it is filled with in a hex triplet format, i.e. #ffd5d5 for light pink.
(3) id, the ID for the path mentioned above, in this case I chose its parish code as ID, but it could be anything.
Writing the script
Next, we need a script that will change the color of the parish depending on the feature value in our spreadsheet, so that if the value is “yes”, it will change the color to e.g. red, but if the value is “no”, the color will be light orange. If I don’t have the data for a certain parish, I chose gray as a color. My data is binary, but you could set as many colors as you want depending on your value, e.g. red for one etymon, green for another, blue for a third, etc.
The code
We need two packages: xml.etree.ElementTree in order to read the SVG as XML, and pandas in order to work with spreadsheets.
import xml.etree.ElementTree as ET
import pandas as pd
First I load my spreadsheet data.
df = pd.read_csv('dalarna_data.csv', dtype={'parish_code': object}, encoding='utf-8')
Then I load my basemap as an XML tree.
tree = ET.parse('dalarna_basemap.svg')
root = tree.getroot()
ns = "http://www.w3.org/2000/svg"
I then make a list of all the feature columns, and I store the parish codes with the features in a dictionary.
all_features = df.columns[2:].tolist()
df_dict = df.set_index('parish_code').T.to_dict()
This is the final part of the code. For each column (each feature), the code goes through the XML tree and looks for the parish code (the ID). It then looks at the feature column and changes the style of the object by changing the color to #a50f15 (dark red) for “yes”, #fee5d9 (light orange) for “no” and #cccccc (gray) for “no data”. You could add more parameters and colors to this list of course. Finally, I save all the maps in a folder called “maps” with the title “dalarna” followed by the column name.
for i in all_features:
for element in root.iterfind("./{%s}g/*" % ns):
parish_code = element.attrib['id']
value = df_dict[parish_code][i]
if value == 'yes':
element.set('style', 'fill:#a50f15;stroke:#000000')
if value == 'no':
element.set('style', 'fill:#fee5d9;stroke:#000000')
if value == 'no data':
element.set('style', 'fill:#cccccc;stroke:#000000')
tree.write('<my_path>/maps/dalarna_{}.svg'.format(i))
Conclusion
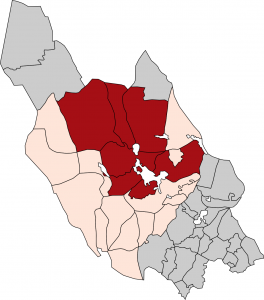
Quite easily, I could generate two maps of two phonological features in the dialects of Dalarna, and it would be quite easy to make more by adding more columns.
There are some pitfalls to this method. For instance, it does not capture variation within the parish. Quite often, villages within the same parish will differ from one another. Our method does not really allow us to capture this, for instance by different shades of red.
What we can do is either to create more sub-areas, for instance northern and southern Lima with two different IDs. Another solution is to have one color for parameter a, one for b, and then one color in between a and b for areas that have both.
The part which requires the most work is of course to create the basemap. If you are working with a large area with hundreds of language areas, then creating an SVG basemap is going to take a long time, but so would making every map individually. If you know that you are going to create many maps of this kind using that basemap as a background, then it might be a good investment to create a good high-quality SVG basemap that allows for this kind of manipulation in the future.